telegraphic codes and message practice
scanned code directory
Weather Code, Numeral System (1939)
U.S. Department of Agriculture, Weather Bureau
The 1939 Weather Code (Numeral System) became effective in June 1939, for use at first and second order stations of the Weather Bureau.
It replaced the Weather Code, Revised 1936 (word code), and was constructed on principles adopted by the International Meteorological Organization.
Apart from the transition from codewords to figures, the most prominent differences from the 1896 code are : increased attention to clouds (three levels rather than one) and visibility (both being of obvious interest to aeronautical users), and a much expanded network of stations.
Some limited allowance is given for use of plain language words : in connection with very high wind velocities, barometer and, precipitation, and temperature readings, and frost.
I have not been able to compare this to the 1936 edition, but gather from the heading under Examples of Coded Observations (page 19) that the 1936 edition was fundamentally the same in all but its coding method. The transition to a numeric code speaks to the increased reliability of teletype networks, over the telegraph system available in previous decades. By this time, facsimile transmission would have been available for aeronautical users, but teletype symbol weather reports continued to be used, for weather reports transmitted by the Civil Aeronautics Authority over its system of telegraph and radio facilities.
Two examples are shown below —
 |
|
| example 1 (p19), Weather Code, Numeral System (1939) | |
All observations begin with name of station, and them move methodically through tables 30 through 46.
Note in passing that the first example is for a report from Lander, Wyoming; my copy of the 1896 Code belonged to that station.
 |
|
| example 5 (p23), Weather Code, Numeral System (1939) | |
The Weather Code (Numeral System) (1939) included — in addition to identification of code groups, definition of letter symbols, descriptions of the code elements, a list of stations (with their index numbers) and the code tables, these three separate documents/sheets —
- alphabetical list of stations with international index numbers
- a map showing stations and their international index numbers for the U.S. and Canada; and
- a single large (53.5 x 42cm)
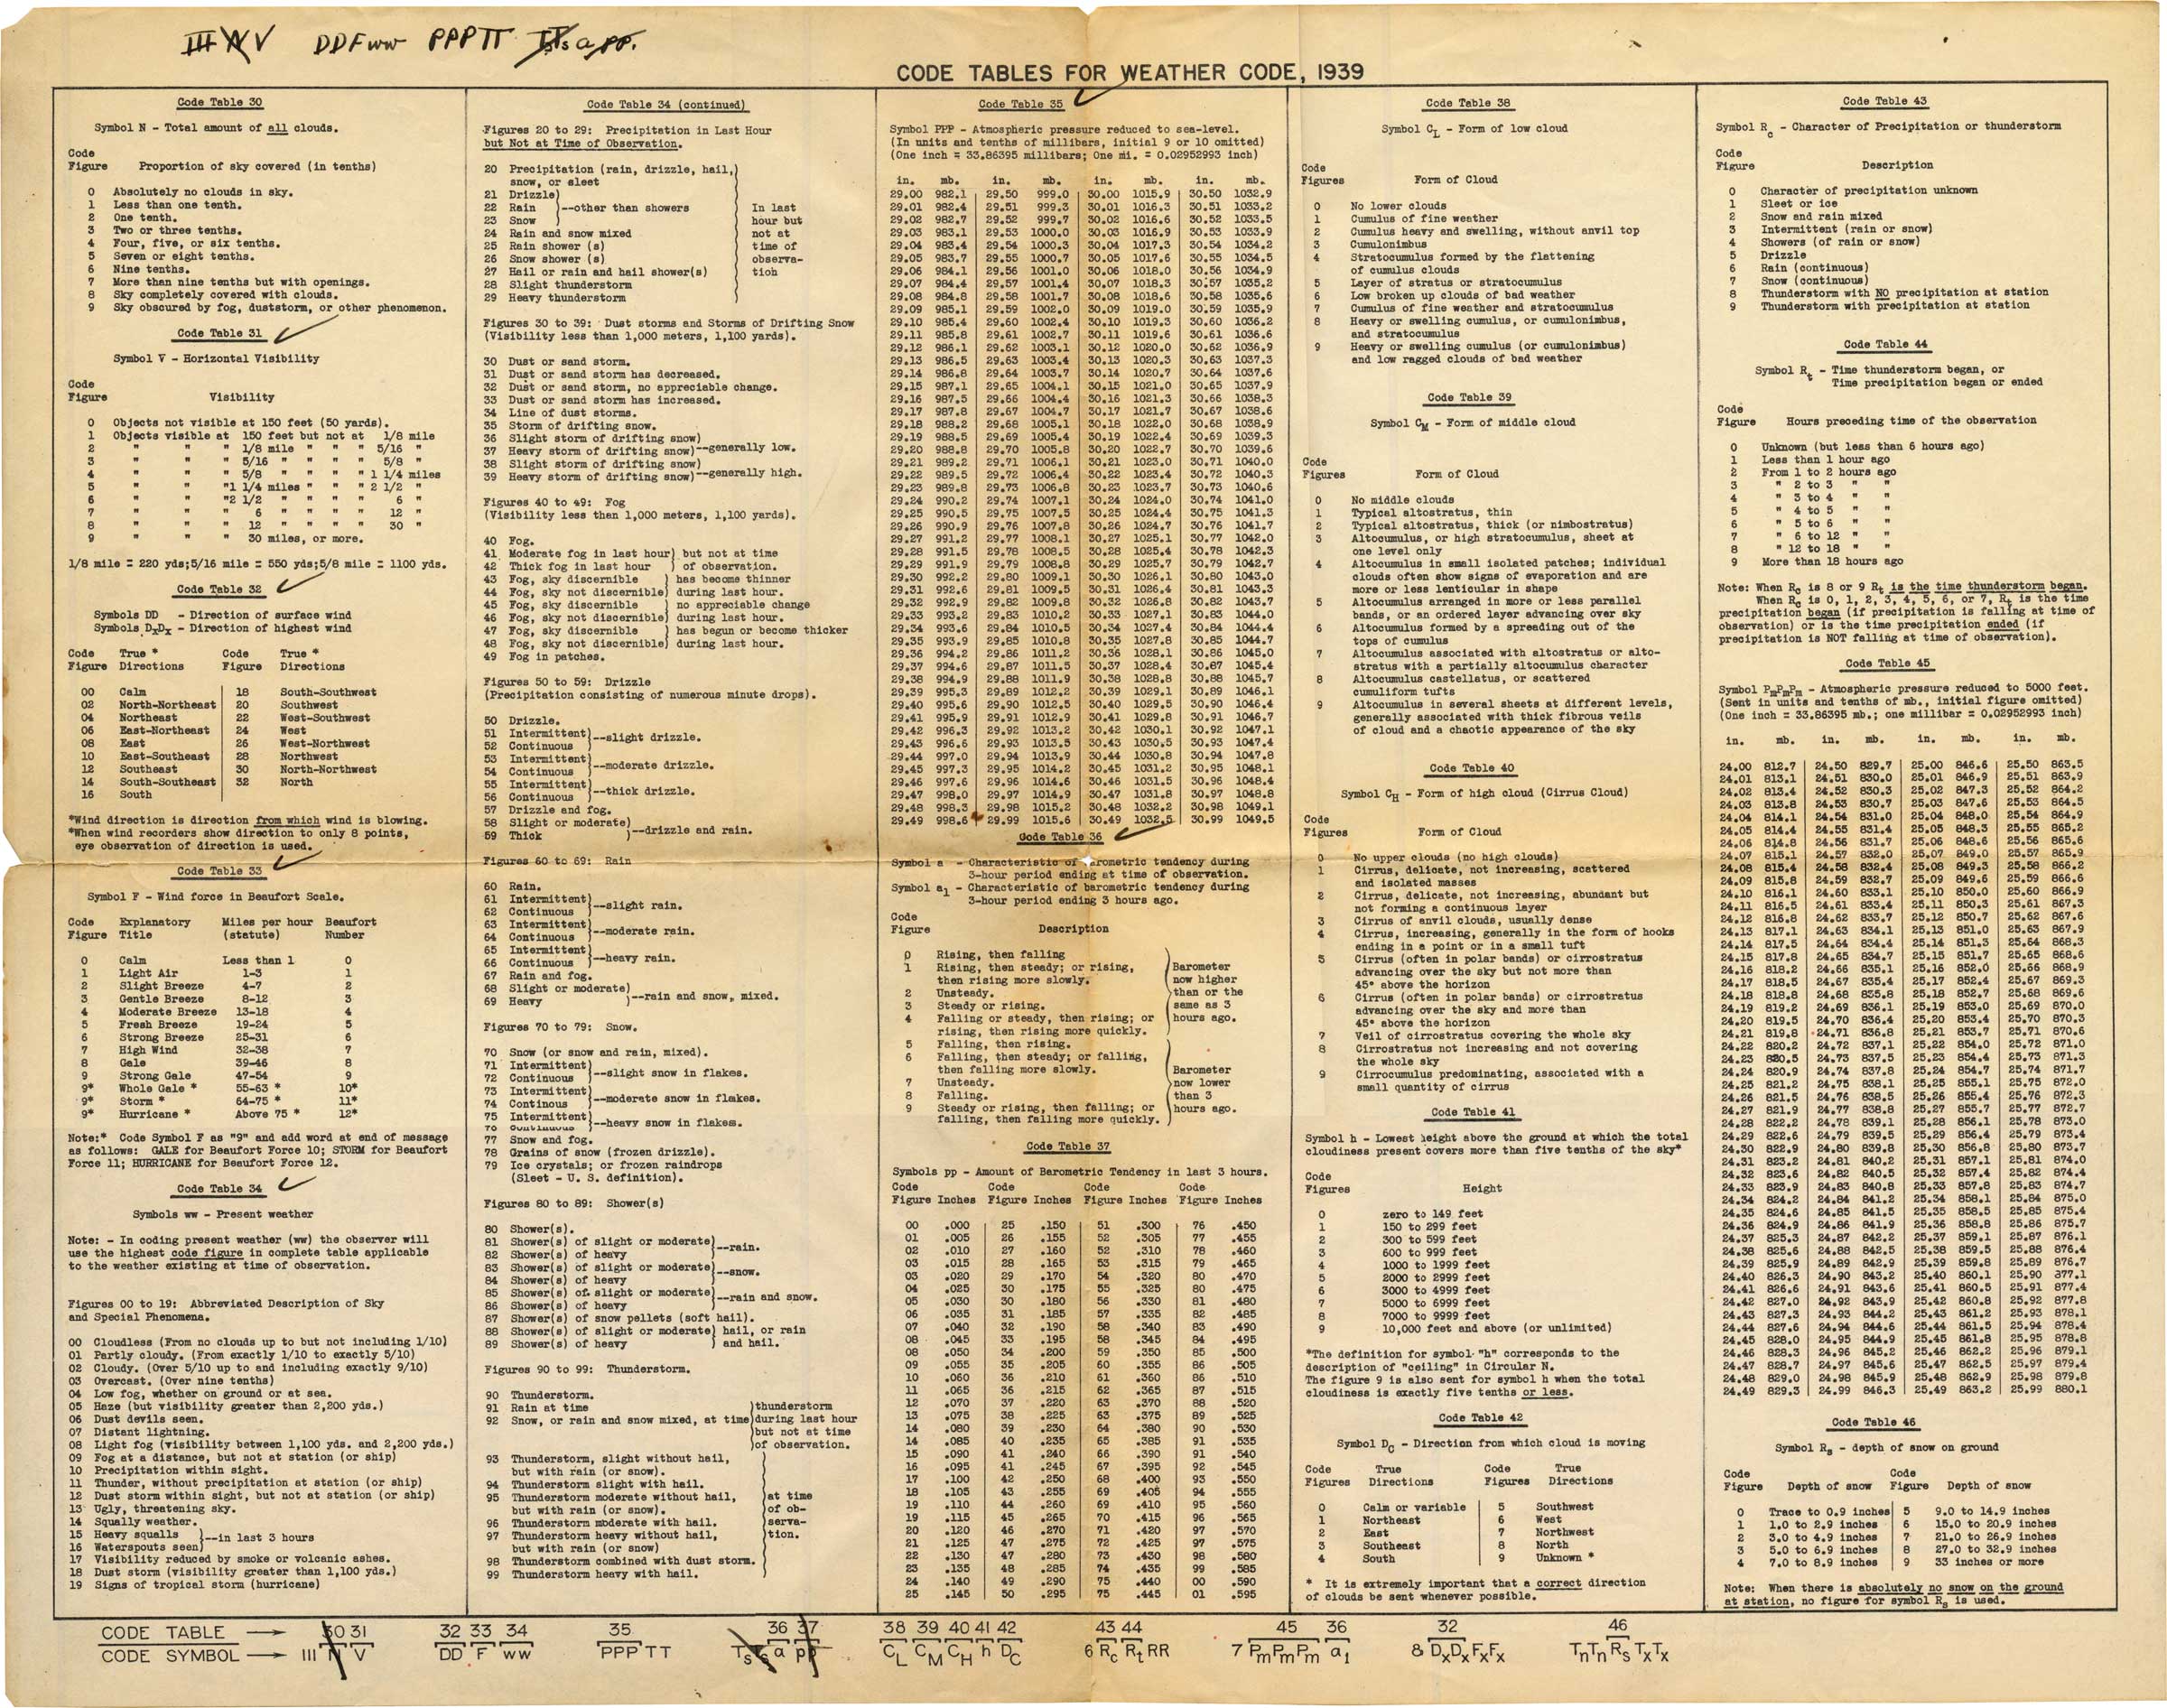
Code Tables for Weather Code, 1939
how did this work?
Shown below — move cursor over thumbnail at left, for enlargment at right — is an image of those code tables. One assembles a a report by moving through tables 30 through 36. This is essentially a figure code, position in the sequence being the crucial determinant of meaning. A report (message) might run 35 or 40 figures long, in five-figure groups. The formation of observation report No. 5 above can be traced through this code table. (Not easily, hard copy is better!)
|
|
| Code Tables for Weather Code, 1939 move cursor over thumbnail, to see enlargement at right. |
It is in the systematic assembly of information from meteorological observations, using a figure code, that we can most easily envision a transition to entirely automated reading
and filing
of data, for automated generation of synoptic reports incorporating data from many sources. The modern term for this would be telemetry.
The step-by-step procedures for generating these observations, however, were already established in the late 1900s.